


CBSE Class 10 Maths – MCQ and Online Tests – Unit 14 – Statistics
Every year CBSE conducts board exams for 10th standard. These exams are very competitive to all the students. So our website provides online tests for all the 10th subjects. These tests are also very effective and useful for those who preparing for competitive exams like NEET, JEE, CA etc. It can boost their preparation level and confidence level by attempting these chapter wise online tests.
These online tests are based on latest CBSE Class 10 syllabus. While attempting these our students can identify the weak lessons and continuously practice those lessons for attaining high marks. It also helps to revise the NCERT textbooks thoroughly.

CBSE Class 10 Maths – MCQ and Online Tests – Unit 14 – Statistics
Question 1.
Cumulative frequency curve is also called
(a) histogram
(b) ogive
(c) bar graph
(d) median
Answer
Answer: (b) ogive
Question 2.
The relationship between mean, median and mode for a moderately skewed distribution is
(a) mode = median – 2 mean
(b) mode = 3 median – 2 mean
(c) mode = 2 median – 3 mean
(d) mode = median – mean
Answer
Answer: (b) mode = 3 median – 2 mean
Hint:
Mode = 3 median – 2 mean
Question 3.
The median of set of 9 distinct observations is 20.5. If each of the largest 4 observations of the set is increased by 2, then the median of the new set
(a) is increased by 2
(b) is decreased by 2
(c) is two times of the original number
(d) Remains the same as that of the original set.
Answer
Answer: (d) Remains the same as that of the original set.
Hint:
No. of observations = 9
∴ median = 5th observation
∵ The largest four observations are increased
∴ 5th observation remains unchanged.
Question 4.
Mode and mean of a data are 12k and 15A. Median of the data is
(a) 12k
(b) 14k
(c) 15k
(d) 16k
Answer
Answer: (b) 14k
Hint:
∵ Mode = 3 median – 2 mean
⇒ 12k = 3 median – 2 × 15k
⇒ 42k = 3 median
⇒ Median = 14k.
Question 5.
The times, in seconds, taken by 150 atheletes to run a 110 m hurdle race are tabulated below:
| Class | Frequency |
| 13.8 – 14.0 | 2 |
| 14.0 – 14.2 | 4 |
| 14.2 – 14.4 | 5 |
| 14.4 – 14.6 | 71 |
| 14.6 – 14.8 | 48 |
| 14.8 – 15.0 | 20 |
The number of atheletes who completed the race in less then 14.6 seconds is:
(a) 11
(b) 71
(c) 82
(d) 130
Answer
Answer: (c) 82
Question 6.
The abscissa of the point of intersection of the less than type and of the more than type cumulative frequency curves of a grouped data gives its
(a) mean
(b) median
(c) mode
(d) all the three above
Answer
Answer: (b) median
Question 7.
Mean of n numbers x1, x2, … xn is m. If xn is replaced by x, then new mean is
(a) m – xn + x
(b) \(\frac{nm-x_n+x}{n}\)
(c) \(\frac{(n-1)m+x}{n}\)
(d) \(\frac{m-x_n+x}{n}\)
Answer
Answer: (b) \(\frac{nm-x_n+x}{n}\)
Hint: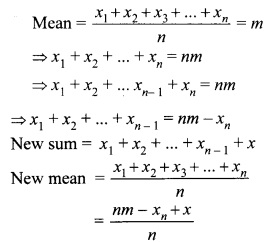
Question 8.
While computing mean of grouped data, we assume that the frequencies are [NCERT Exemplar Problems]
(a) evenly distributed over all the classes
(b) centred at the classmarks of the classes
(c) centred at the upper limits of the classes
(d) centred at the lower limits of the classes
Answer
Answer: (b) centred at the classmarks of the classes
Question 9.
Mean of 100 items is 49. It was discovered that three items which should have been 60, 70, 80 were wrongly read as 40, 20, 50 respectively. The correct mean is
(a) 48
(b) 49
(c) 50
(d) 60
Answer
Answer: (c) 50
Hint:
Sum of 100 observations
= 100 × 49 = 4900
Correct sum
= 4900 – [40 + 20 + 50 ] + [60 + 70 + 80] = 5000
∴ Correct mean = \(\frac{5000}{100}\) = 50.
Question 10.
The times, in seconds, taken by 150 atheletes to run a 100 m hurdle race are tabulated below:
| Class | Frequency |
| 13.8-14 | 3 |
| 14 – 14.2 | 4 |
| 14.2 – 14.4 | 6 |
| 14.4 – 14.6 | 69 |
| 14.6 – 14.8 | 48 |
| 14.8 – 15.0 | 20 |
The number of atheletes who completed the race in less than 14.6 seconds is
(a) 13
(b) 69
(c) 82
(d) 130
Answer
Answer: (c) 82
Question 11.
For the following distribution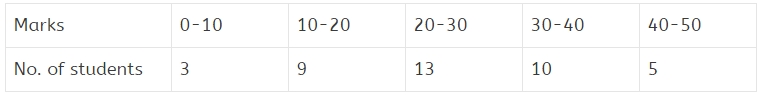
the number of students who got marks less than 30 is
(a) 13
(b) 25
(c) 10
(d) 12
Answer
Answer: (b) 25
Question 12.
In the given data:
| C.I | Frequency |
| 65-85 | 4 |
| 85 – 105 | 5 |
| 105 – 125 | 13 |
| 125 – 145 | 20 |
| 145 – 165 | 14 |
| 165 – 185 | 7 |
| 185 – 205 | 4 |
the difference of the upper limit of the median class and the lower limit of the modal class is
(a) 38
(b) 20
(c) 19
(d) 0
Answer
Answer: (b) 20
Question 13.
For the following distribution
| Marks | No. of students |
| Less than 20 | 4 |
| Less than 40 | 12 |
| Less than 60 | 25 |
| Less than 80 | 56 |
| Less than 100 | 74 |
| Less than 120 | 80 |
the modal class is
(a) 20 – 40
(b) 40 – 60
(c) 60 – 80
(d) 80 -100
Answer
Answer: (c) 60 – 80
Question 14.
For the following distribution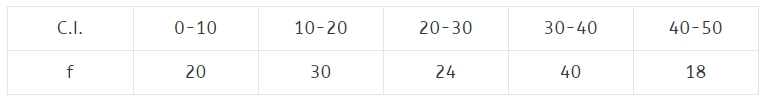
the sum of lower limits of the modal class and the median class is
(a) 20
(b) 30
(c) 40
(d) 50
Answer
Answer: (d) 50
Question 15.
While computing mean of grouped data, we assume that the frequencies are
(a) centred at the upper limits of the classes
(b) centred at the lower limits of the classes
(c) centred at the classmarks of the classes
(d) evenly distributed over all the classes
Answer
Answer: (c) centred at the classmarks of the classes
Question 16.
Which of the following can not be determined graphically?
(a) Mean
(b) Median
(c) Mode
(d) None of these
Answer
Answer: (a) Mean
Question 17.
Mode is the
(a) middle most frequent value
(b) least frequent value
(c) maximum frequent value
(d) none of these
Answer
Answer: (c) maximum frequent value


0 Comments:
Post a Comment