


CBSE Class 8 Maths – MCQ and Online Tests – Unit 15 – Introduction to Graphs
Every year CBSE students attend Annual Assessment exams for 6,7,8,9,11th standards. These exams are very competitive to all the students. So our website provides online tests for all the 6,7,8,9,11th standards’ subjects. These tests are also very effective and useful for those who preparing for any competitive exams like Olympiad etc. It can boost their preparation level and confidence level by attempting these chapter wise online tests.
These online tests are based on latest CBSE syllabus. While attempting these, our students can identify their weak lessons and continuously practice those lessons for attaining high marks. It also helps to revise the NCERT textbooks thoroughly

CBSE Class 8 Maths – MCQ and Online Tests – Unit 15 – Introduction to Graphs
Observe the following bar graph and answer the related questions: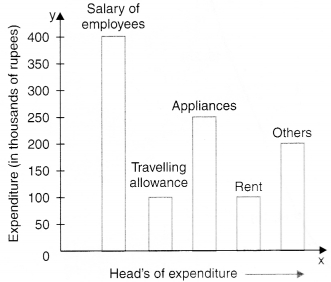
Question 1.
What is the sum of the expenditures (in thousands of rupees) on travelling allowance and rent ?
(a) 100
(b) 200
(c) 300
(d) 400.
Answer
Answer: (b) 200
Hint:
100 + 100 = 200
Question 2.
On which head/heads, is the expenditure minimum ?
(a) Travelling allowance/rent
(b) Appliances
(c) Salary of employees
(d) Others.
Answer
Answer: (a) Travelling allowance/rent
Hint:
The length of the bar corresponding to the head travelling allowance/rent is minimum.
Question 3.
On which two heads, is the expenditure same ?
(a) Salary of employees and others
(b) Travelling allowance and rent
(c) Appliances and rent
(d) Appliances and others.
Answer
Answer: (b) Travelling allowance and rent
Hint:
The lengths of the bars corresponding to the heads travelling allowance and rent are the same.
Question 4.
What is the difference of expenditures (in thousands of rupees) on salary of employees and rent ?
(a) 100
(b) 200
(c) 300
(d) 400.
Answer
Answer: (c) 300
Hint:
400 – 100 = 300
Question 5.
On which head, is the expenditure maximum ?
(a) Travelling allowance
(b) Rent
(c) Appliances
(d) Salary of employees.
Answer
Answer: (d) Salary of employees.
Hint:
The length of the bar corresponding to the head ‘salary of employees’ is maximum.
Observe the following circle-graph and answer the related questions:
Question 1.
What is the sum of the expenditures on food and education if the budget of the family is Rs 10800 ?
(a) Rs 5000
(b) Rs 8000
(c) Rs 5400
(d) Rs 6000.
Answer
Answer: (c) Rs 5400
Hint:
150 + 30 = 180
\(\frac{180}{360}\) × 10800 = 5400
Question 2.
On which head is the expenditure minimum ?
(a) Education
(b) House rent
(c) Food
(d) Clothes.
Answer
Answer: (a) Education
Hint:
The central angle is minimum for education.
Question 3.
If the budget of the family is Rs 10800, what is the saving ?
(a) Rs 1050
(b) Rs 1000
(c) Rs 950
(d) Rs 1200.
Answer
Answer: (a) Rs 1050
Hint:
Saving = \(\frac{35}{360}\) × 10800 = 1050.
Question 4.
On which head is the expenditure maximum ?
(a) Food
(b) Clothes
(c) House rent
(d) Education.
Answer
Answer: (a) Food
Hint:
The central angle is maximum for food.
Question 5.
What is the difference of expenditures on clothes and education if the budget of the family is Rs 10800 ?
(a) Rs 1200
(b) Rs 1000
(c) Rs 800
(d) Rs 1500.
Answer
Answer: (a) Rs 1200
Hint:
70 – 30 = 40
\(\frac{40}{360}\) × 10800 = 1200.
Observe the following histogram and answer the related questions: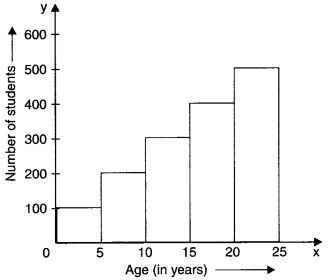
Question 1.
The sum of the number of students in the class intervals 10-15 and 20-25 is
(a) 800
(b) 900
(c) 600
(d) 400.
Answer
Answer: (a) 800
Hint:
10-15 ? 300
20-25 ? 500
300 + 500 = 800.
Question 2.
In which class interval, are the minimum number of students ?
(a) 0-5
(b) 5-10
(c) 10-15
(d) 15-20.
Answer
Answer: (a) 0-5
Hint:
The length of the rectangle on 0 – 5 is maximum.
Question 3.
In which class intervals, is the number of students 200 ?
(a) 5-10
(b) 0-5
(c) 20-25
(d) 15-20.
Answer
Answer: (a) 5-10
Hint:
5-10 ? 200
Question 4.
In which class interval, are the maximum number of students ?
(a) 0-5
(b) 5-10
(c) 20-25
(d) 15-20.
Answer
Answer: (c) 20-25
Hint:
The length of the rectangle on 20 – 25 is maximum.
Question 5.
The difference in the number of students of class intervals 0-5 and 5-10 is
(a) 100
(b) 200
(c) 300
(d) 400.
Answer
Answer: (a) 100
Hint:
0-5 ? 100
5-10 ? 200
200-100 = 100
Observe the following temperature time graph and answer the related questions: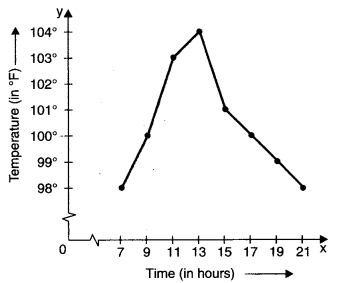
Question 1.
What is the fall in temperature from 13 hours to 21 hours ?
(a) 2°F
(b) 3°F
(c) 4°F
(d) 6°F
Answer
Answer: (d) 6°F
Hint:
104 – 98 = 6
Question 2.
At what time(s) is the temperature minimum ?
(a) 7 hours and 21 hours
(b) 9 hours
(c) 11 hours
(d) 13 hours.
Answer
Answer: (a) 7 hours and 21 hours
Hint:
7, 21 ? 98°F
Question 3.
103°F temperature is at time
(a) 11 hours
(b) 13 hours
(c) 15 hours
(d) 21 hours.
Answer
Answer: (a) 11 hours
Hint:
103°F ? 11 hours
Question 4.
What is the difference of temperatures at 7 hours and 21 hours ?
(a) 0°F
(b) 1°F
(c) 2°F
(d) 3°F.
Answer
Answer: (a) 0°F
Hint:
98-98 = 0
Question 5.
What is the rise in temperature from 11 hours to 13 hours ?
(a) 1°F
(b) 2°F
(c) 4°F
(d) 3°F.
Answer
Answer: (a) 1°F
Hint:
104 – 103 = 1
Question 6.
The coordinates of the origin are
(a ) (0, 0)
(b) (1, 0)
(c) (0, 1)
(d) (1, 1).
Answer
Answer: (a ) (0, 0)
Hint:
0 ? (0, 0)
Question 7.
What are the coordinates of a point whose x-coordinate is 3 and y-coordinate is 4?
(a) (3, 3)
(b) (3, 4)
(c) (4, 3)
(d) (4, 3).
Answer
Answer: (b) (3, 4)
Question 8.
What are the coordinates of a point whose x-coordinate is 1 and y-coordinate isO?
(a) (1, 0)
(b) (0, 0)
(c) (0, 1)
(d) (1, 1).
Answer
Answer: (a) (1, 0)
Question 9.
What are the coordinates of a point whose x-coordinate is 0 and y-coordinate is 1?
(a) (0, 1)
(b) (0, 0)
(c) (1, o)
(d) (1, 1).
Answer
Answer: (a) (0, 1)
Observe the following velocity-time graph and answer the related questions: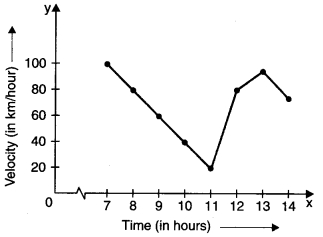
Question 1.
At what time is the velocity minimum ?
(a) 8
(b) 9
(c) 10
(d) 11.
Answer
Answer: (d) 11
Hint:
11 ? 20
Question 2.
At what times are the velocities equal ?
(a) 8 and 12
(b) 9 and 11
(c) 7 and 12
(d) 11 and 13.
Answer
Answer: (a) 8 and 12
Hint:
8 ? 80
12 ? 80
Question 3.
What is the fall in velocity from 7 to 11 ?
(a) 80 km/hour
(b) 90 km/hour
(c) 100 km/hour
(d) 20 km/hour.
Answer
Answer: (a) 80 km/hour
Hint:
100 – 20 = 80
Question 4.
What is the rise in velocity from 11 to 12?
(a) 10 km/hour
(b) 20 km/hour
(c) 30 km/hour
(d) 60 km/hour.
Answer
Answer: (d) 60 km/hour
Hint:
80 – 20 = 60
Question 5.
At what time is the velocity maximum ?
(a) 7
(b) 8
(c) 9
(d) 10.
Answer
Answer: (a) 7
Hint:
7 ? 100
Observe the following runs-over graph and answer the related questions: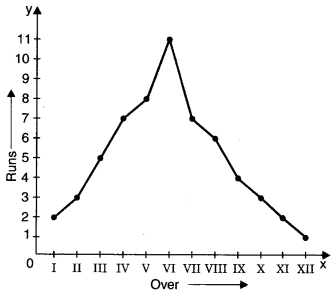
Question 1.
3 runs are scored in which overs ?
(a) II and X
(b) I and V
(c) VII and VIII
(d) X and XII
Answer
Answer: (a) II and X
Hint:
II ? 3, X ? 3
Question 2.
In which over are the minimum runs scored ?
(a) X
(b) XI
(c) XII
(d) IX.
Answer
Answer: (c) XII
Hint:
XII ? 1
Question 3.
What is the difference of runs scored in IV and V overs ?
(a) 1
(b) 2
(c) 3
(d) 4.
Answer
Answer: (a) 1
Hint:
8 – 7 = 1
Question 4.
What is the sum of runs scored in I and XII overs ?
(a) 1
(b) 2
(c) 3
(d) 4.
Answer
Answer: (c) 3
Hint:
2 + 1 = 3
Question 5.
In which over are the maximum runs scored ?
(a) II
(b) IV
(c) V
(d) VI.
Answer
Answer: (d) VI
Hint:
VI ? 11
Read the graph and answer the related questions: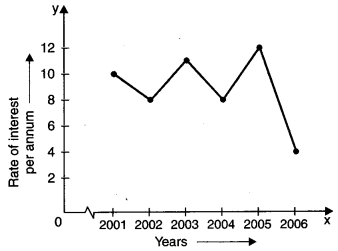
Question 1.
The fall in interest from 2001 to 2002 was
(a) 1%
(b) 2%
(c) 3%
(d) 4%.
Answer
Answer: (b) 2%
Hint:
10 – 8 = 2
Question 2.
In which year was the rate of interest minimum ?
(a) 2006
(b) 2004
(c) 2001
(d) 2005.
Answer
Answer: (a) 2006
Hint:
2006 ? 4
Question 3.
The difference in the maximum and minimum rates of interest was
(a) 2%
(b) 4%
(c) 6%
(d) 8%.
Answer
Answer: (d) 8%
Hint:
12 – 4 = 8
Question 4.
Rise in interest from 2004 to 2005 was
(a) 2%
(b) 4%
(c) 6%
(d) 8%.
Answer
Answer: (b) 4%
Hint:
12 – 8 = 4
Question 5.
In which year was the rate of interest maximum ?
(a) 2005
(b) 2003
(c) 2006
(d) 2002.
Answer
Answer: (a) 2005
Hint:
2005 ? 12
Read the graph and answer the related questions: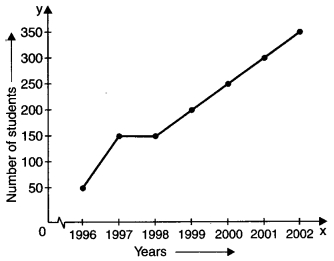
Question 1.
In which year did 50 students appear ?
(a) 1998
(b) 2001
(c) 1997
(d) 1996.
Answer
Answer: (d) 1996
Hint:
50 ? 1996
Question 2.
In which two years was the number of students appearing was the same ?
(a) 1997 and 1998
(b) 1998 and 1999
(c) 1999 and 2000
(d) 2000 and 2001.
Answer
Answer: (a) 1997 and 1998
Hint:
1997 ? 150
1998 ? 150
Question 3.
In which year did the maximum number of students appear ?
(a) 2002
(b) 2000
(c) 2001
(d) 1999.
Answer
Answer: (a) 2002
Hint:
2002 ? 350
Question 4.
What is the maximum number of students that appeared in any year ?
(a) 350
(b) 300
(c) 250
(d) 300.
Answer
Answer: (a) 350
Hint:
350
Question 5.
How many students appeared in the year 2000 ?
(a) 200
(b) 250
(c) 300
(d) 350.
Answer
Answer: (b) 250
Hint:
2000 ? 250
Read the graph and answer the related questions: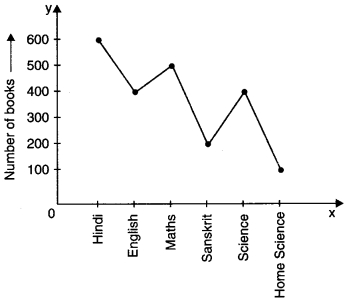
Question 1.
How many books are there in Sanskrit and Home Science taken together ?
(a) 100
(b) 200
(c) 300
(d) 400.
Answer
Answer: (c) 300
Hint:
Sanskrit ? 200
Home Science ? 100
200 + 100 = 300
Question 2.
The minimum books are of which subject ?
(a) Home Science
(b) Sanskrit
(c) Science
(d) English
Answer
Answer: (a) Home Science
Hint:
Home Science ? 100
Question 3.
500 books are of which subject ?
(a) English
(b) Science
(c) Hindi
(d) Maths.
Answer
Answer: (d) Maths
Hint:
500 ? Maths
Question 4.
The maximum books are of which subject ?
(a) Hindi
(b) Science
(c) English
(d) Sanskrit.
Answer
Answer: (a) Hindi
Hint:
Hindi ? 600
Question 5.
How many books are of subject Home Science ?
(a) 100
(b) 200
(c) 300
(d) 400.
Answer
Answer: (a) 100
Hint:
Home Science ? 100
Read the graph and answer the related questions: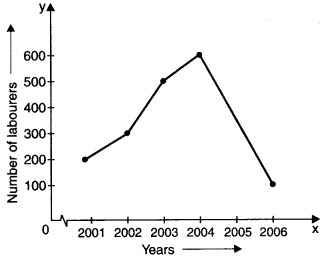
Question 1.
Find the rise in the number of labourers from 2001 to 2004.
(a) 200
(b) 300
(c) 400
(d) 500.
Answer
Answer: (c) 400
Hint:
2001 ? 200
2004 ? 600
600 – 200 = 400
Question 2.
In which year was the number of labourers minimum ?
(a) 2003
(b) 2004
(c) 2005
(d) 2006.
Answer
Answer: (d) 2006
Hint:
2006 ? 100
Question 3.
What was the difference of the number of labourers in the years 2002 and 2003 ?
(a) 100
(b) 200
(c) 300
(d) 400.
Answer
Answer: (b) 200
Hint:
2002 ? 300
2003 ? 500
500 – 300 = 200
Question 4.
In which year was the number of labourers maximum ?
(a) 2001
(b) 2002
(c) 2003
(d) 2004.
Answer
Answer: (d) 2004
Hint:
2004 ? 500
Question 5.
Find the sum of the number of labourers in the years 2004 and 2006.
(a) 700
(b) 600
(c) 200
(d) 500.
Answer
Answer: (a) 700
Hint:
2004 ? 600
2006 ? 100
600 + 100 = 700
Read the circle graph and answer the related questions: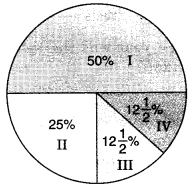
Question 1.
A ________ is a bar graph that shows data in intervals.
(a) Bar-graph
(b) Pie-chart
(c) Histograph
(d) Line Graph
Answer
Answer: (c) Histograph
Question 2.
The number of students of class II is
(a) 500
(b) 250
(c) 125
(d) 100.
Answer
Answer: (b) 250
Hint:
\(\frac{25}{100}\) x 1000 = 250
Question 3.
In which two classes is the number of students the same ?
(a) I and II
(b) I and III
(c) III and IV
(d) I and IV.
Answer
Answer: (c) III and IV
Hint:
III ? 12\(\frac{1}{2}\)%
IV ? 12\(\frac{1}{2}\)%
Question 4.
There are in all 1000 students in a school. The number of students of class I are
(a) 500
(b) 250
(c) 125
(d) none of these.
Answer
Answer: (a) 500
Hint:
\(\frac{50}{100}\) × 1000 = 500
Question 5.
The minimum number of students in any class is
(a) 125
(b) 250
(c) 500
(d) 1000.
Answer
Answer: (a) 125
Hint:
\(\frac{25}{2}\) × \(\frac{1000}{100}\) = 125
Question 6.
The sum of the number of students of class III and class IV is
(a) 500
(b) 1000
(c) 50
(d) 250.
Answer
Answer: (d) 250
Hint:
125 + 125 = 250
Question 7.
A graph that displays data that changes continuously over periods of time is called:
(a) Bar-graph
(b) Pie-chart
(c) Histograph
(d) Line Graph
Answer
Answer: (d) Line Graph
Question 8.
A line graph which is a whole unbroken line is called a:
(a) Linear graph
(b) Pie-chart
(c) Histograph
(d) Bar-graph
Answer
Answer: (a) Linear graph
Question 9.
Which point lies of y-axis?
(a) (-2, 0)
(b) (2, 0)
(c) (0, -2)
(d) (2, -2)
Answer
Answer: (c) (0, -2)
Question 10.
The point (0, 0) lies at:
(a) x-axis
(b) y-axis
(c) origin
(d) None of the above
Answer
Answer: (c) origin
Question 11.
The point (4, 0) lies on which of the following?
(a) x-axis
(b) y-axis
(c) origin
(d) None of the above
Answer
Answer: (a) x-axis
Question 12.
The point (-2,-2) is:
(a) near to x-axis
(b) near to y-axis
(c) near to origin
(d) Equidistant from x-axis and y-axis.
Answer
Answer: (d) Equidistant from x-axis and y-axis.
Question 13.
The point (-2, 5) is nearer to:
(a) x-axis
(b) y-axis
(c) origin
(d) None of the above
Answer
Answer: (a) x-axis
Question 14.
The point (-5, 2) is nearer to:
(a) x-axis
(b) y-axis
(c) origin
(d) None of the above
Answer
Answer: (b) y-axis
Question 15.
If we join (-3,2), (-3,-3) and (-3,4), then we obtain:
(a) A triangle
(b) Straight-line without passing through origin
(c) Straight-line passing through origin
(d) None of the above
Answer
Answer: (b) Straight-line without passing through origin


0 Comments:
Post a Comment