


CBSE Class 9 Maths – MCQ and Online Tests – Unit 14 – Statistics
Every year CBSE schools conducts Annual Assessment exams for 6,7,8,9,11th standards. These exams are very competitive to all the students. So our website provides online tests for all the 6,7,8,9,11th standard’s subjects. These tests are also very effective and useful for those who preparing for any competitive exams like Olympiad etc. It can boost their preparation level and confidence level by attempting these chapter wise online tests.
These online tests are based on latest CBSE syllabus. While attempting these our students can identify the weak lessons and continuously practice those lessons for attaining high marks. It also helps to revise the NCERT textbooks thoroughly.

CBSE Class 9 Maths – MCQ and Online Tests – Unit 14 – Statistics
Question 1.
A grouped frequency distribution table with classes of equal sizes using 63-72 (72 included) as one of the class is constructed for the following data:
30, 32, 45, 54, 74, 78, 108, 112, 66, 76, 88, 40, 14, 20, 15, 35, 44, 66, 75, 84, 95, 96, 102, 110, 88, 74, 112, 14, 34, 44.
The number of classes in the distribution will be:
(a) 9
(b) 10
(c) 11
(d) 12
Answer
Answer: (b) 10
Question 2.
Let m be the mid-point and 1 be the lower class limit of a class in a continuous frequency distribution. The upper class limit of the class is:
(a) 2m + l
(b) 2m – l
(c) m – l
(d) m – 2l
Answer
Answer: (b) 2m – l
Question 3.
The class marks of a frequency distribution are given as follows:
15, 20, 25, …
The class corresponding to the class mark 15 is:
(a) 12.5 – 17.5
(b) 17.5 – 22.5
(c) 18.5 – 21.5
(d) 19.5 – 20.5
Answer
Answer: (a) 12.5 – 17.5
Question 4.
In the class intervals 10-20, 20-30, the number 20 is included in:
(a) 10-20
(b) 20-30
(c) both the intervals
(d) none of these intervals
Answer
Answer: (b) 20-30
Question 5.
A grouped frequency table with class intervals of equal sizes using 250-270 (270 not included in this interval) as one of the class interval is constructed for the following data:
268, 220, 368, 258, 242, 310, 272, 342, 310, 290, 300, 320, 319, 304,402, 318, 406, 292, 354, 278, 210, 240, 330, 316, 406, 215, 258, 236.
The frequency of the class 370-390 is:
(a) 0
(b) 1
(c) 3
(d) 5
Answer
Answer: (a) 0
Question 6.
The class mark of the class 90-130 is:
(a) 90
(b) 105
(c) 115
(d) 110
Answer
Answer: (d) 110
Question 7.
The range of the data:
25, 81, 20, 22, 16, 6, 17,15,12, 30, 32, 10, 91, 8, 11, 20 is
(a) 10
(b) 75
(c) 85
(d) 26
Answer
Answer: (c) 85
Question 8.
Mode of the data
15, 14, 19, 20, 16, 15, 16, 14, 15, 18, 14, 19, 16, 17, 16 is
(a) 14
(b) 15
(c) 16
(d) 17
Answer
Answer: (c) 16
Question 9.
The mean of 25 observations is 26. Out of these observations if the mean of first 13 observations is 22 and that of the last 13 observations is 30, the 13th observation is:
(a) 23
(b) 26
(c) 28
(d) 30
Answer
Answer: (b) 26
Question 10.
If \(\bar { x } \) represents the mean of n observations x1, x2, …, xn, then value of \(\sum_{i=1}^{n}\left(x_{i}-\bar{x}\right)\) is:
(a) -1
(b) 0
(c) 1
(d) n – 1
Answer
Answer: (b) 0
Question 11.
If each observation of the data is increased by 5, then their mean
(a) remains the same
(b) becomes 5 times the original mean
(c) is decreased by 5
(d) is increased by 5
Answer
Answer: (d) is increased by 5
Question 12.
Let \(\bar { x } \) be the mean of x1, x2, …, xn and y the mean of y1, y2, …, yn. If z is the mean of x1, x2, …. xn, y1, y2, …, yn, then z is equal to
(a) \(\bar {x}+\bar{y} \)
(b) \(\frac{\bar {x}+\bar{y}}{2}\)
(c) \(\frac{\bar {x}+\bar{y}}{n}\)
(d) \(\frac{\bar {x}+\bar{y}}{2n}\)
Answer
Answer: (b) \(\frac{\bar {x}+\bar{y}}{2}\)
Question 13.
If \(\bar { x } \) is the mean of x1, x2, …, xn, then for a ? 0, the mean of ax1, ax2, …, axn, \(\frac{x_1}{a}\), \(\frac{x_2}{a}\), …….., \(\frac{x_n}{a}\) is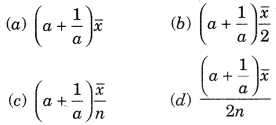
Answer
Answer: (b)
Question 14.
If \(\bar { x_1 } \), \(\bar { x_2 } \), \(\bar { x_3 } \), …….., \(\bar { x_n } \) are the means of n groups with n1, n2, ……. nn number of observations respectively, then the mean x of all the groups taken together is given by: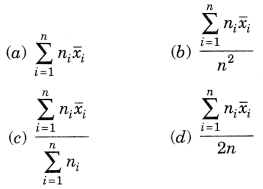
Answer
Answer: (c)
Question 15.
In a frequency distribution, the mid value of a class is 10 and the width of the class is 6. The upper limit of the class is:
(a) 6
(b) 7
(c) 10
(d) 13
Answer
Answer: (d) 13
Question 16.
The width of each of five continuous classes in a frequency distribution is 5 and the lower class-limit of the lowest class is 10. The lower class-limit of the highest class is:
(a) 15
(b) 30
(c) 35
(d) 40
Answer
Answer: (b) 30
Question 17.
The median of the data
78, 56, 22, 34, 45, 54, 39, 68, 54, 84 is
(a) 45
(b) 49.5
(c) 54
(d) 56
Answer
Answer: (c) 54
Question 18.
For drawing a frequency polygon of a continous frequency distribution, we plot the points whose ordinates are the frequencies of the respective classes and abcissae are respectively:
(a) upper limits of the classes
(b) lower limits of the classes
(c) class marks of the classes
(d) upper limits of preceding classes
Answer
Answer: (c) class marks of the classes
Question 19.
To draw a histogram to represent the following frequency distribution: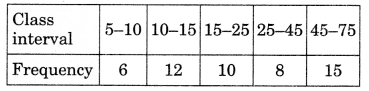
the adjusted frequency for the class 25-45 is:
(a) 6
(b) 5
(c) 3
(d) 2
Answer
Answer: (d) 2
Question 20.
The mean of five numbers is 30. If one number is excluded, their mean becomes 28. the excluded number is:
(a) 28
(b) 30
(c) 35
(d) 38
Answer
Answer: (d) 38


0 Comments:
Post a Comment